- The profit margins for Exxon (XON/NYSE) should be significantly higher than other S&P 500 stocks.
- The P/E ratio should be significantly higher on the stock, reflecting the above average profit potential of the company.
- The share performance, over the long run, be superior to all other stocks on the S&P 500.
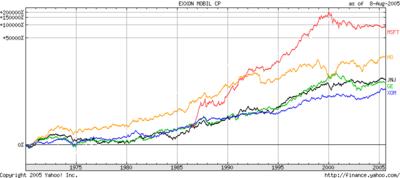
Let's see how they line up. For comparison, let's use Johnson & Johnson (JNJ/NYSE), WalMart (WMT/NYSE), Microsoft (MSFT/NASDAQ), and Philip Morris (MO/NYSE) as a sample of comparable sized companies in different sectors.
First, let's take a look at the long term charts for these stocks (see above). XOM is not even the top performer over the long-term vis other sectors of the economy. Second, the profit margin for XOM as of today is 9.94%. WMT is 3.63%, JNJ is 18.36%, MO is 14.55%, and GE is 11.29%. These numbers suggest, along with the chart above, the XOM's profitability is within the expectations of the largest S&P 500 companies.
In summary, the profitability of integrated oil companies are in line with the market as a whole, and is reflected in the relative performance of oil companies versus other sectors.
When I have the time, I'll make a more detailed analysis of the sector and the claim of 'obscene' profits.
No comments:
Post a Comment