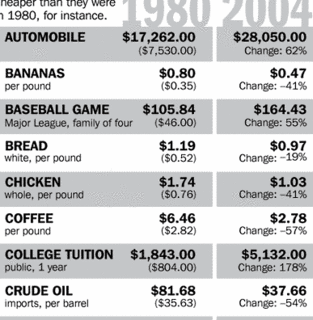
Many of you probably have seen this chart, showing the differences in prices on an absolute and real basis on a few items from 1980 versus today. The other key statistic that is missing is that in 1980, long term interest rates (i.e. 30-year Treasury) were in the 15% range, while today long term rates are 4.5%. That is a key thing to consider as well. A family with a mortgage generally had a rougher go of it in 1980 than 2004 in terms of prices and costs of housing. Another factor is the general improvement of fuel economy of cars during this period, which also is a mitagating factor.
The reason for the high oil prices today, are of course political instability, but an examination of what the 'fair value' of what oil should be is about 20% lower. There is a supply imbalance at this moment of time. One of the main reasons behind this was large oil companies scaling back exploration efforts five years ago when oil was $10/barrel, which in hindsight, was a foolish thing to do. More supplies will be coming online in the next couple of years, which will put downward pressure on supplies. As for the increasing demand from China & India - yes it is true that their demands for oil have increased, but as a percentage of world consumption, they are only a small percentage at this moment in time; thus their incremental consumption should not have as much of an impact on prices as what some think they will be.
Hat tip to Kate for the chart.
1 comment:
I believe there may be an error in your html coding. Your post seems to be lacking a referring link or two.
Kate
Post a Comment